Moondrops AI Phase 2: Meet Your New Quantitative Analyst

From Data Summary to Strategic Playbook.
When we launched the original Moondrops AI Insights, our goal was to save you time. We wanted to take the mountain of data from 388+ assets and condense it into a readable summary.
But "summary" isn't enough. As traders, we don't just need to know what happened; we need to know what to do about it.
Today, we are deploying Phase 2 of our AI Market Intelligence.
We have completely rebuilt the engine behind our AI. We moved away from simple text summarization and built a proprietary Quantitative Logic Engine that acts less like a reporter and more like a skeptical, risk-averse Quantitative Analyst.
Here is how it works, and why it changes the game for your trading routine.
The Problem: "The Regime" vs. "The Event"
Most market analysis fails because it confuses two different things:
- The Regime (The Weather): Is the broad market trending, chopping, or reversing?
- The Event (The Lightning Strike): Are there specific, actionable signals (like breakouts or crossovers) happening right now?
In a complex market, these two forces are often at war. For example, the market might be in a Strong Downtrend (Regime), but a sudden burst of Bullish MACD Crosses (Event) suggests a sharp rally is imminent.
A standard AI summary would just list those facts side-by-side. Phase 2 synthesizes them into a strategy.
The New Executive Summary
We have redesigned the daily report into a lean, three-part "C-Suite" dashboard designed to be read in under 30 seconds.
1. Key Trade Setups (The Playbook)
This is the most significant upgrade. Instead of making you hunt for setups, the AI now prioritizes the "Needle-in-the-Haystack" events and presents them as actionable playbooks.
It analyzes the conflict between the Event and the Regime to give you specific strategies:
- Confluence Setups: When the trend and the signals align (e.g., "Bearish Trend-Following").
- Conflict Setups: When the signals fight the trend (e.g., "Counter-Trend Rally" or "Short the Rip").
It provides the Strategy, the Reasoning, and the Specific Signals to watch for validation.
2. Market Regime Classification (The Context)
We built a proprietary "Sorter" engine that categorizes every single asset into one of 9 distinct market states—from Strong Uptrend to Low-Volatility Coil.
The AI uses this data to classify the dominant personality of the market. Is today a trend day? A chop day? Or a capitulation bottom? This gives you the immediate context you need to adjust your risk appetite.
3. Market Conviction Score (The Risk Gauge)
It’s easy to trade when everything agrees. It’s dangerous when data conflicts.
Our new Conviction Score (0-10) measures the alignment between the long-term trend and short-term momentum.
- High Score (8-10): All systems go. Aggressive sizing is warranted.
- Low Score (2-4): Extreme conflict. The trend says one thing, but price action says another. This is your signal to preserve capital or wait for confirmation.
Under the Hood: The "Skeptical Analyst"
We didn't just prompt the AI to be helpful; we prompted it to be skeptical.
The Phase 2 AI is designed to be risk-averse. It doesn't just cheerlead every green candle. If it sees a bullish breakout on low volume in a bear market, it won't call it a "Moon Mission"—it will call it a "Low-Conviction Trap."
Sample AI Market Insights
Here’s a sample of a real Moondrops AI Market Insights report:
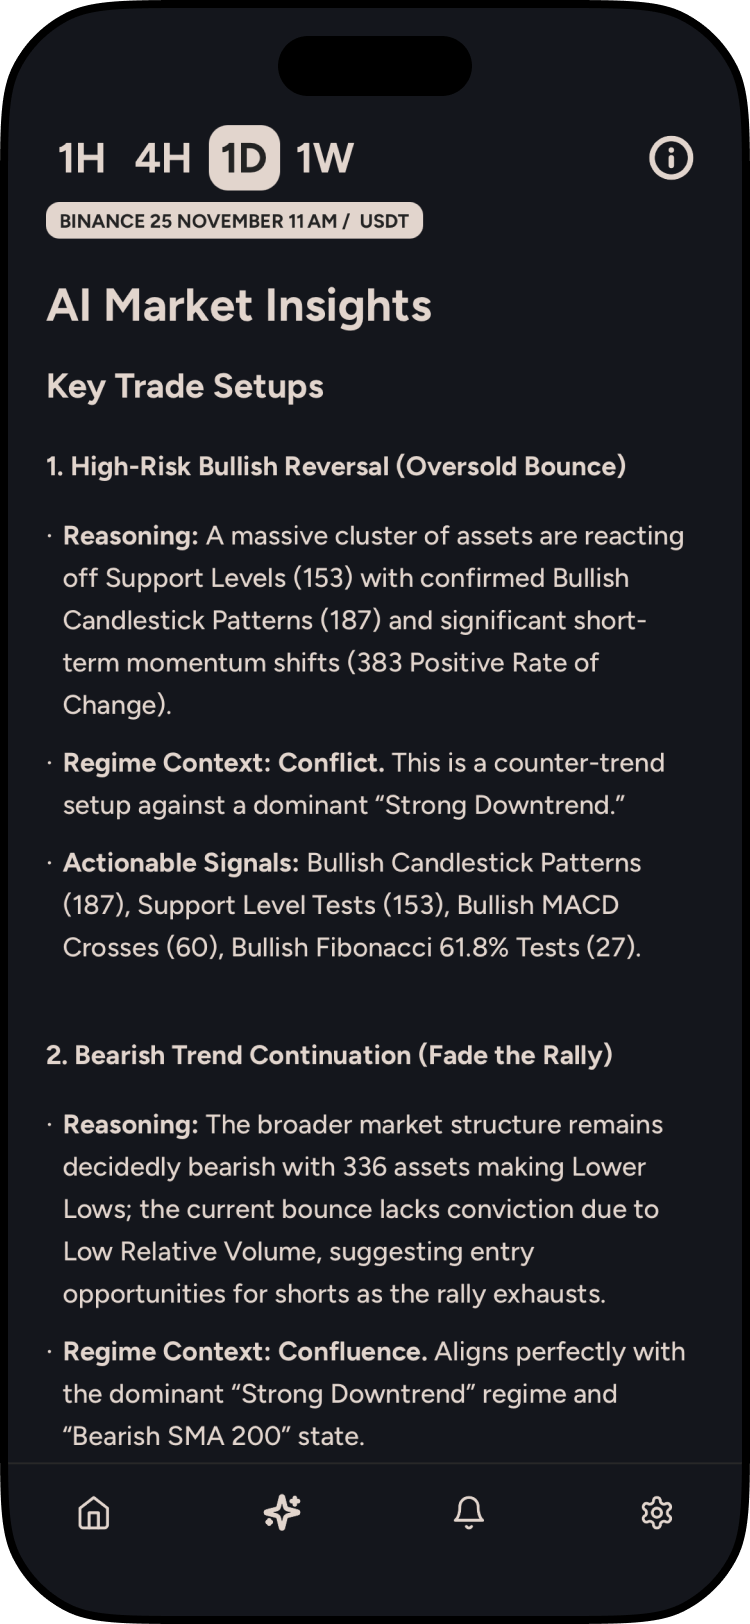
Key Trade Setups
1. High-Risk Bullish Mean Reversion
- Reasoning: A statistically significant cluster of 108 Bullish RSI Divergences combined with 152 assets sitting on Support Levels indicates widespread exhaustion of the current selling pressure.
- Regime Context: Conflict. This setup opposes the dominant 'Strong Downtrend' regime, relying on 'Oversold' metrics (167) and 'Stochastic Oversold' readings (291) for a counter-trend snapback.
- Actionable Signals: 108 Bullish RSI Divergences, 58 Bullish Sweeps, 152 Support Tests.
2. Bearish Trend Continuation (Breakdown Watch)
- Reasoning: The macro structure remains overwhelmingly bearish with 285 assets showing Lower Highs, but low relative volume suggests shorts should wait for confirmed breaks of current support levels.
- Regime Context: Confluence. Aligns perfectly with the 'Strong Downtrend' (283) and 'Negative Volume Delta' (278).
- Actionable Signals: 119 Bearish Candlestick Patterns, 20 Bearish MACD Crosses, 17 Bearish Ichimoku Tenkan/Kijun Crosses.
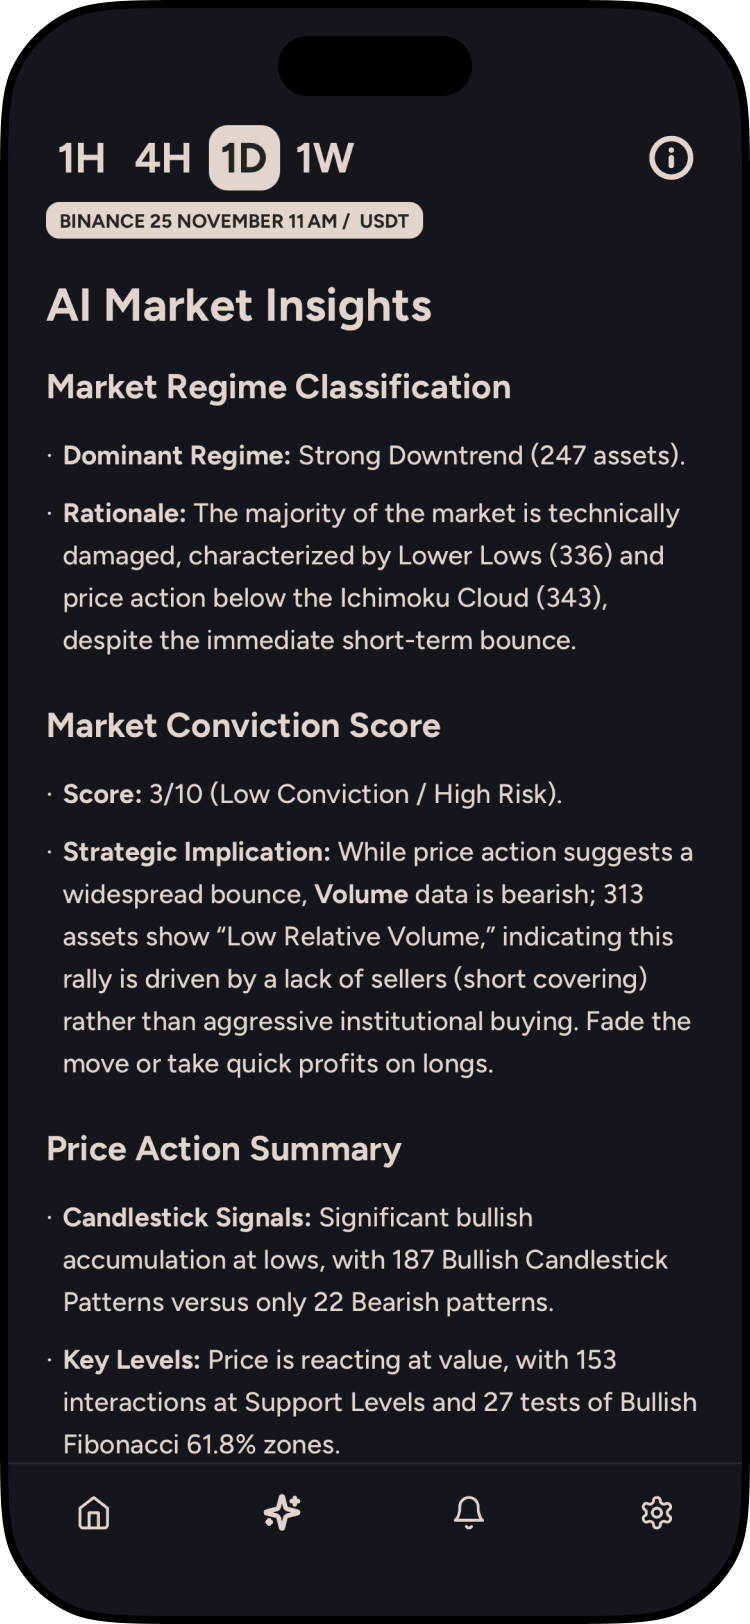
Market Regime Classification
Strong Downtrend The market is in a verified liquidation phase, with 283 assets classified as 'Strong Downtrend' and 344 assets trading below their SMA 200.
Market Conviction Score
3/10 (Bearish Bias / Low Conviction) Strategic Implication: While the trend is definitively bearish, the conviction score is penalized heavily due to Low Relative Volume (319 assets) and extreme oversold conditions. The market is currently "heavy" but lacks the volume participation to force immediate lower lows without a relief rally first.
Price Action Summary
- Key Levels: Assets are testing critical floors, with 152 Support Levels currently active compared to only 1 Resistance Level.
- Liquidity Events: 58 Bullish Sweeps indicate potential stop runs occurring at these support zones.
- Candlesticks: Bearish patterns dominate (119) over Bullish patterns (79), suggesting sellers still control the close despite the support tests.
- Fibonacci: 37 assets are holding the Bullish 61.8% retracement, offering a narrow window for algorithmic buying.
Trend Summary
- Directional Bias: Overwhelmingly Bearish. 344 assets are below the SMA 200 and 341 are below the Ichimoku Cloud.
- Market Structure: Defined by Lower Highs (285) and Lower Lows (243).
- Trend Strength: 264 assets show a 'Strong ADX Trend', confirming the validity of the downside move.
- Moving Average Crosses: Sparse activity, though Bearish MACD Crosses (20) outnumber Bullish ones (11).
Momentum Summary
- Divergences: Significant signal detected—108 Bullish RSI Divergences suggest selling momentum is waning relative to price action.
- Oscillators: Extreme oversold conditions are present. 291 assets show Stochastic Oversold and 389 assets have a Bearish RSI (Below 50).
- Reversal Potential: High probability of a "dead cat bounce" or relief rally given the divergence/oversold confluence.
Volume & Volatility Summary
- Participation: Low Relative Volume (319) indicates the current price action is occurring on weak participation; the bears are not aggressively pushing, but buyers are absent.
- Flow: Negative Volume Delta (278) confirms that aggressive selling is still the primary order flow mechanic.
- Volatility: 25 assets in a 'Low-Volatility Coil' suggests potential expansion is impending, likely resolving in the direction of the next volume spike.
Available Now
This new intelligence engine is live right now in the Moondrops app.
Stop guessing the market's direction. Let the data tell you the story.
Open Moondrops and explore your AI Market Insights today.