Bitcoin Slips Below $60K as Crypto Breadth Breaks Down

Executive Takeaway
Crypto closed the week ending June 29 in a confirmed weak-downtrend posture, not a broad recovery. The Moondrops weekly scan found 241 of 405 assets in Weak Downtrend, 189 in Oversold Regime, and only 53 assets with positive weekly rate of change versus 351 negative. That keeps the base case defensive: oversold rallies are possible, but the market still needs breadth, spot flow, and trend structure to improve before a durable risk-on read is justified.
The cleanest read is pressure plus dispersion. BTC finished near $59.6K, ETH underperformed BTC, and most categories stayed negative, while a few isolated names created sharp countertrend pockets. BTC sentiment also stayed mixed: price fell while open interest contracted, Coinbase traded below Binance, spot flow stayed pressured, and the long/short ratio remained elevated.
Weekly Market State
The closed weekly state was weak across breadth, momentum, and structure. Weak Downtrend was the largest regime cluster at 241 assets, followed by Oversold Regime at 189 and Range-Bound at 175. Strong Downtrend remained large at 123 assets, so the market was not simply neutralizing after a selloff; bearish trend conditions were still widespread.
The conviction score was 6.0/10. That is high enough to respect the signal, but not high enough to treat the outlook as one-directional. The weekly scan showed 198 bearish candlestick patterns against 27 bullish patterns, 351 negative weekly rate-of-change readings against 53 positive readings, and 387 bearish RSI readings against 18 bullish RSI readings. Volume also leaned negative, with 281 assets showing negative volume delta versus 124 positive.
Market structure confirmed the same direction. The scan counted 227 bearish lower-high structures and 305 bearish lower-low structures, while only 62 assets printed bullish higher highs and 44 printed bullish higher lows. The 200-period trend backdrop was also weak, with 187 bearish SMA 200 price-trend readings against only 7 bullish readings.
What Changed From Last Week
- Bearish candlestick patterns increased from 129 to 198.
- Negative volume delta increased from 229 to 281, while positive volume delta fell from 174 to 124.
- Bearish VWAP/price trend readings rose from 326 to 363, while bullish VWAP/price trend readings dropped from 77 to 42.
- Support-level counts fell from 198 to 168, reducing the number of assets sitting on clean weekly support.
- Bearish lower-high and lower-low structures both increased.
The main change was not the regime label; Weak Downtrend persisted. The change was that bearish participation became broader and cleaner while prior support and positive-volume evidence weakened.
How the Week Unfolded
- June 22: Weak Downtrend remained dominant, but the market briefly improved. Positive daily rate-of-change readings rose to 164, and bullish candles outnumbered bearish candles for the day.
- June 23: The bounce failed quickly. Negative daily rate-of-change readings jumped back to 350, and bearish regime count rose to 363.
- June 24: Pressure broadened again. Bearish regime count rose to 386, range conditions compressed, and negative volume delta expanded.
- June 25: The market reached the week’s most bearish internal posture, with 434 bearish regime readings and 214 Oversold Regime readings.
- June 26: A relief day appeared, with 299 assets positive on daily rate of change and 154 bullish candles, but the dominant regime still did not flip away from Weak Downtrend.
- June 27: Weakness reasserted into the close. Weak Downtrend rose to 256 assets, Oversold Regime stayed elevated at 202, Strong Downtrend reached 193, and negative daily rate-of-change readings returned to 329.
The daily path matters because the midweek relief did not repair the weekly structure. It was a bounce inside a downtrend, not evidence of a completed regime reversal.
Category Rotation
Category rotation was defensive. Across 405 matched symbols, the average weekly move was about -6.9%, and the typical asset was down closer to -8.0%. Only 53 symbols finished positive, while 351 finished negative.
Layer 2 screened as the strongest category, but the signal came with clear outlier risk. The group was roughly flat on average only because SYNUSDT surged 118.27%; most Layer 2 names were still lower, and only 2 of 12 finished positive. BICOUSDT was the weakest member at -56.30%. That is not broad Layer 2 strength; it is an outlier-heavy category read.
Oracle and Data was more balanced but still not cleanly bullish, with half the group positive and ACXUSDT providing the best upside. Tokenized Commodity ranked third, but only 1 of its 3 sampled names finished positive, so it also looked more defensive than genuinely strong.
The weakest category screens reinforced the risk-off picture. Gaming averaged a double-digit decline with only 1 positive symbol out of 10, and Stablecoin-linked names also averaged a double-digit decline with no positive symbols in the sampled group.
BTC Sentiment
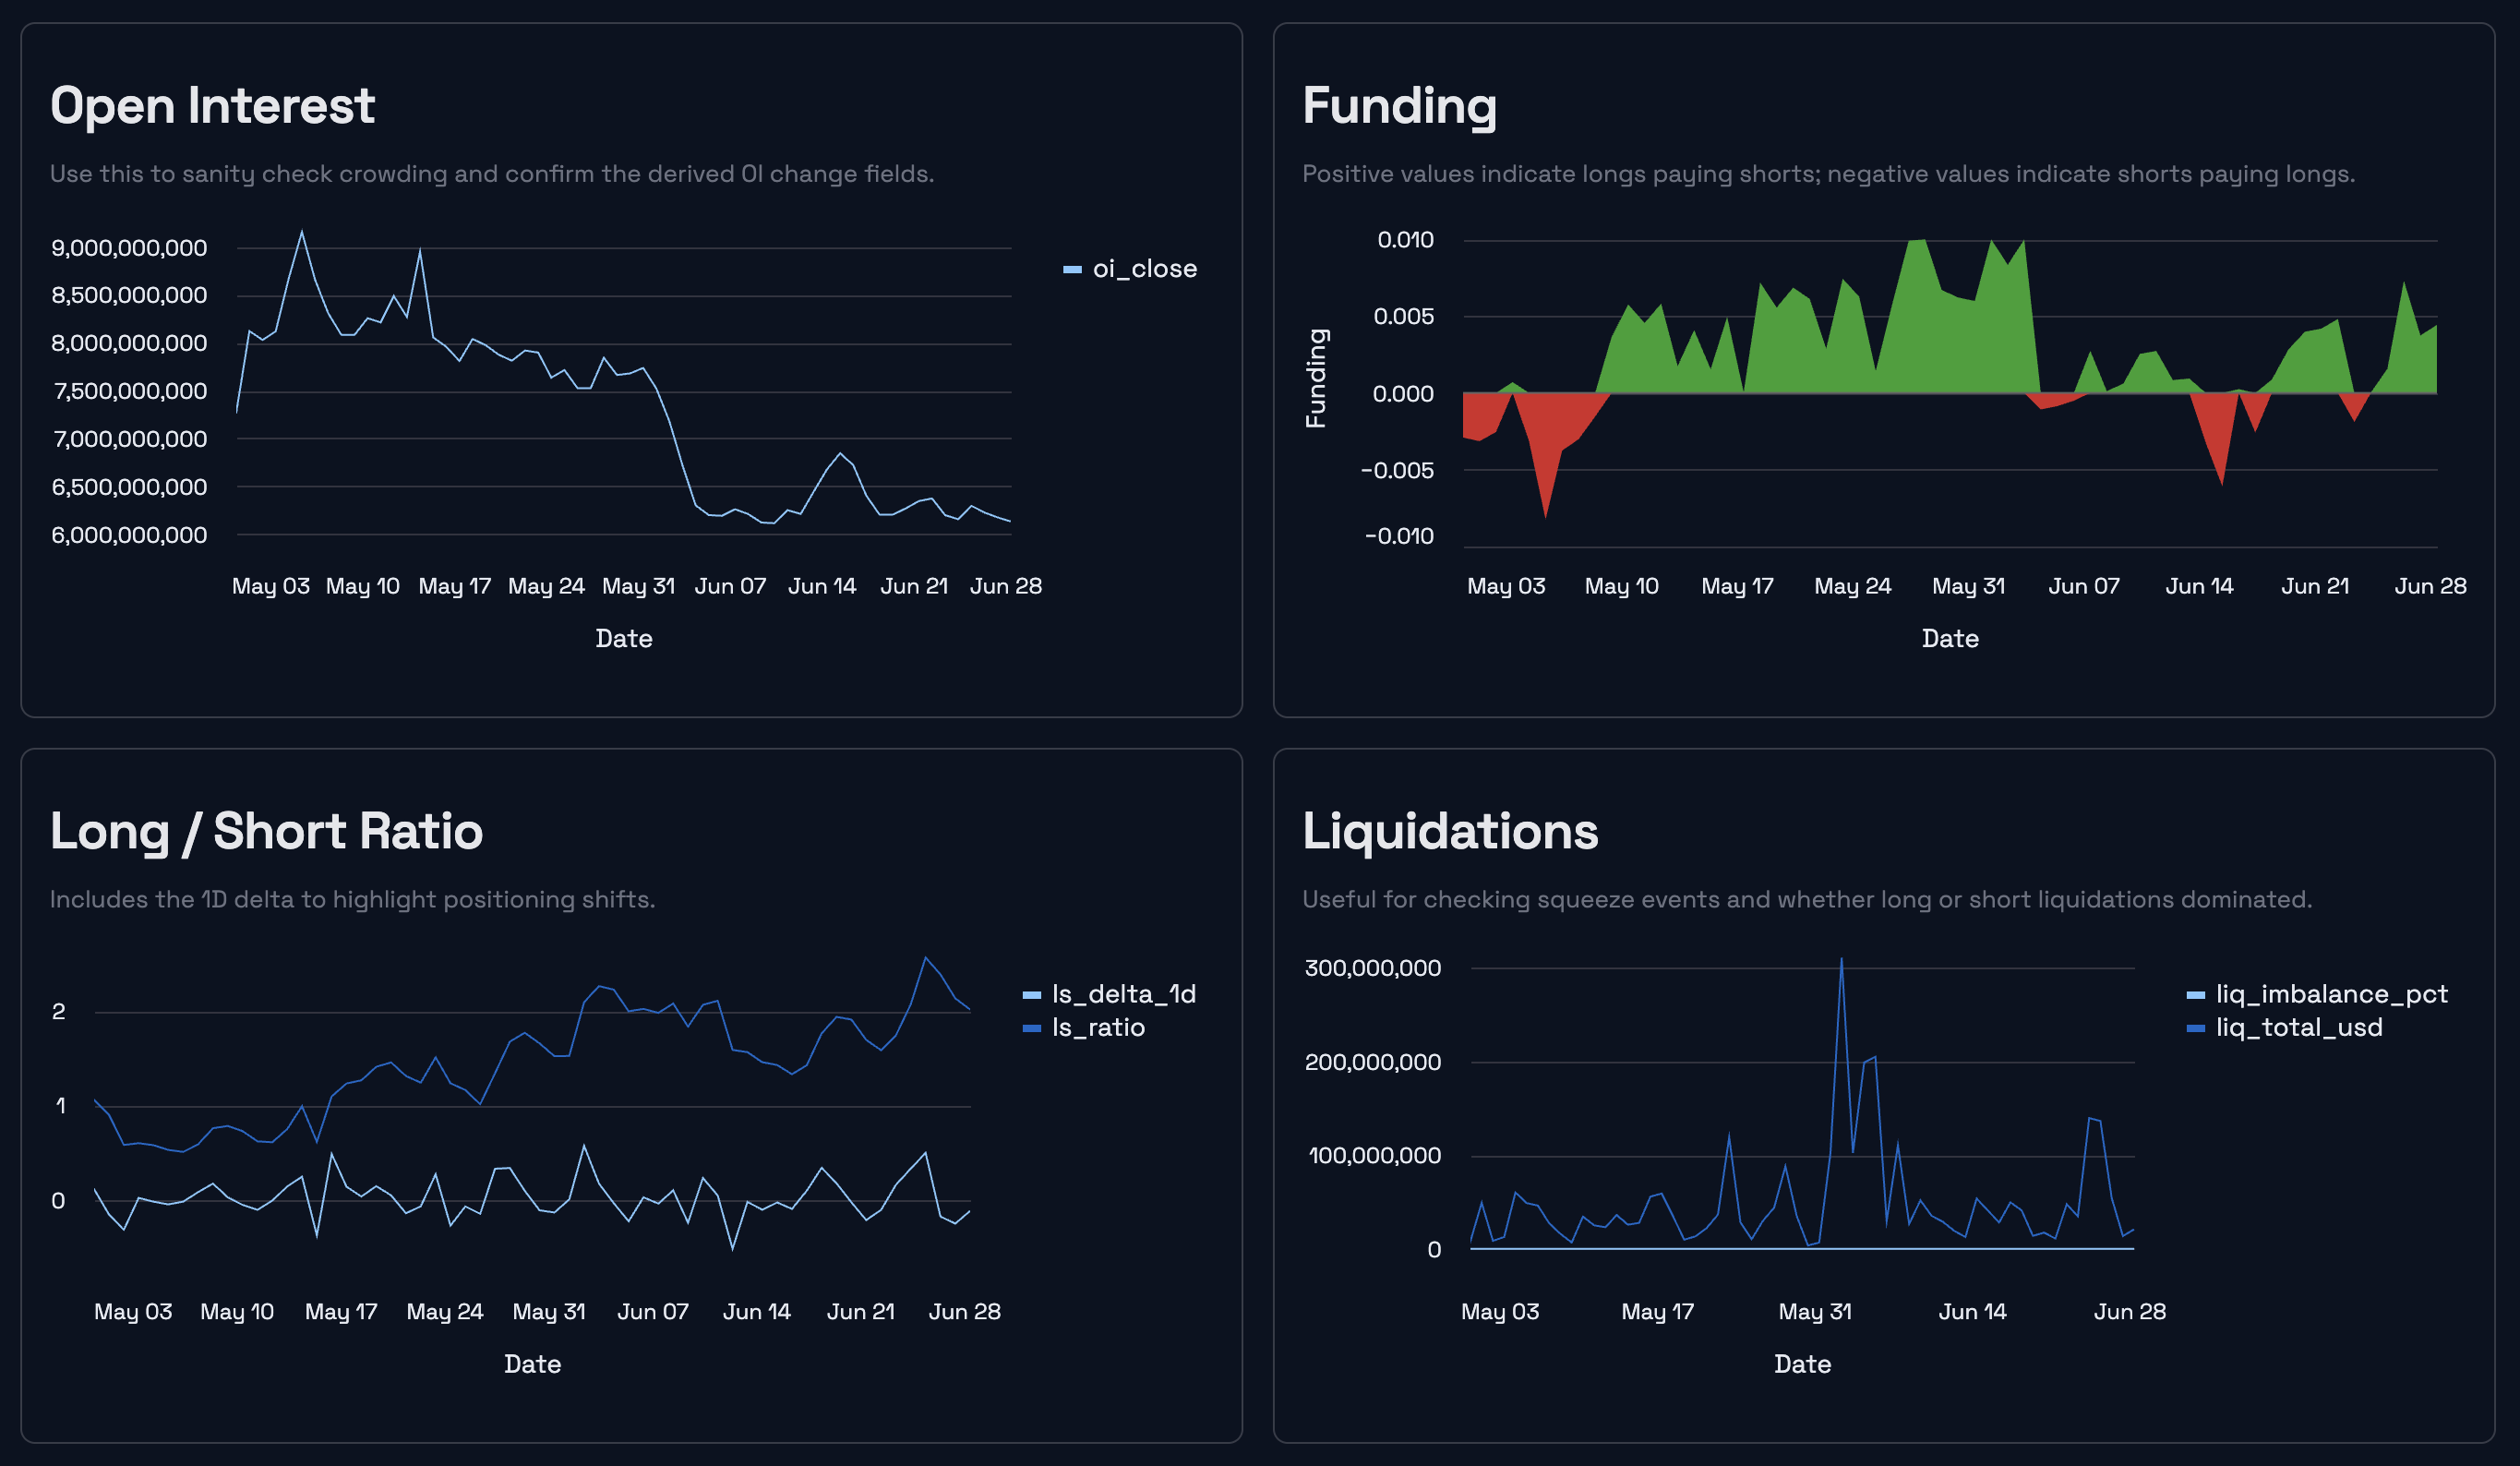
BTC sentiment was mixed / inconclusive, with a fragile deleveraging bias. BTC fell about 5.9% from 63,312.00 to 59,577.01 while open interest contracted by roughly $240.9M. Price down plus open-interest down usually points more toward deleveraging weakness than aggressive bearish expansion.
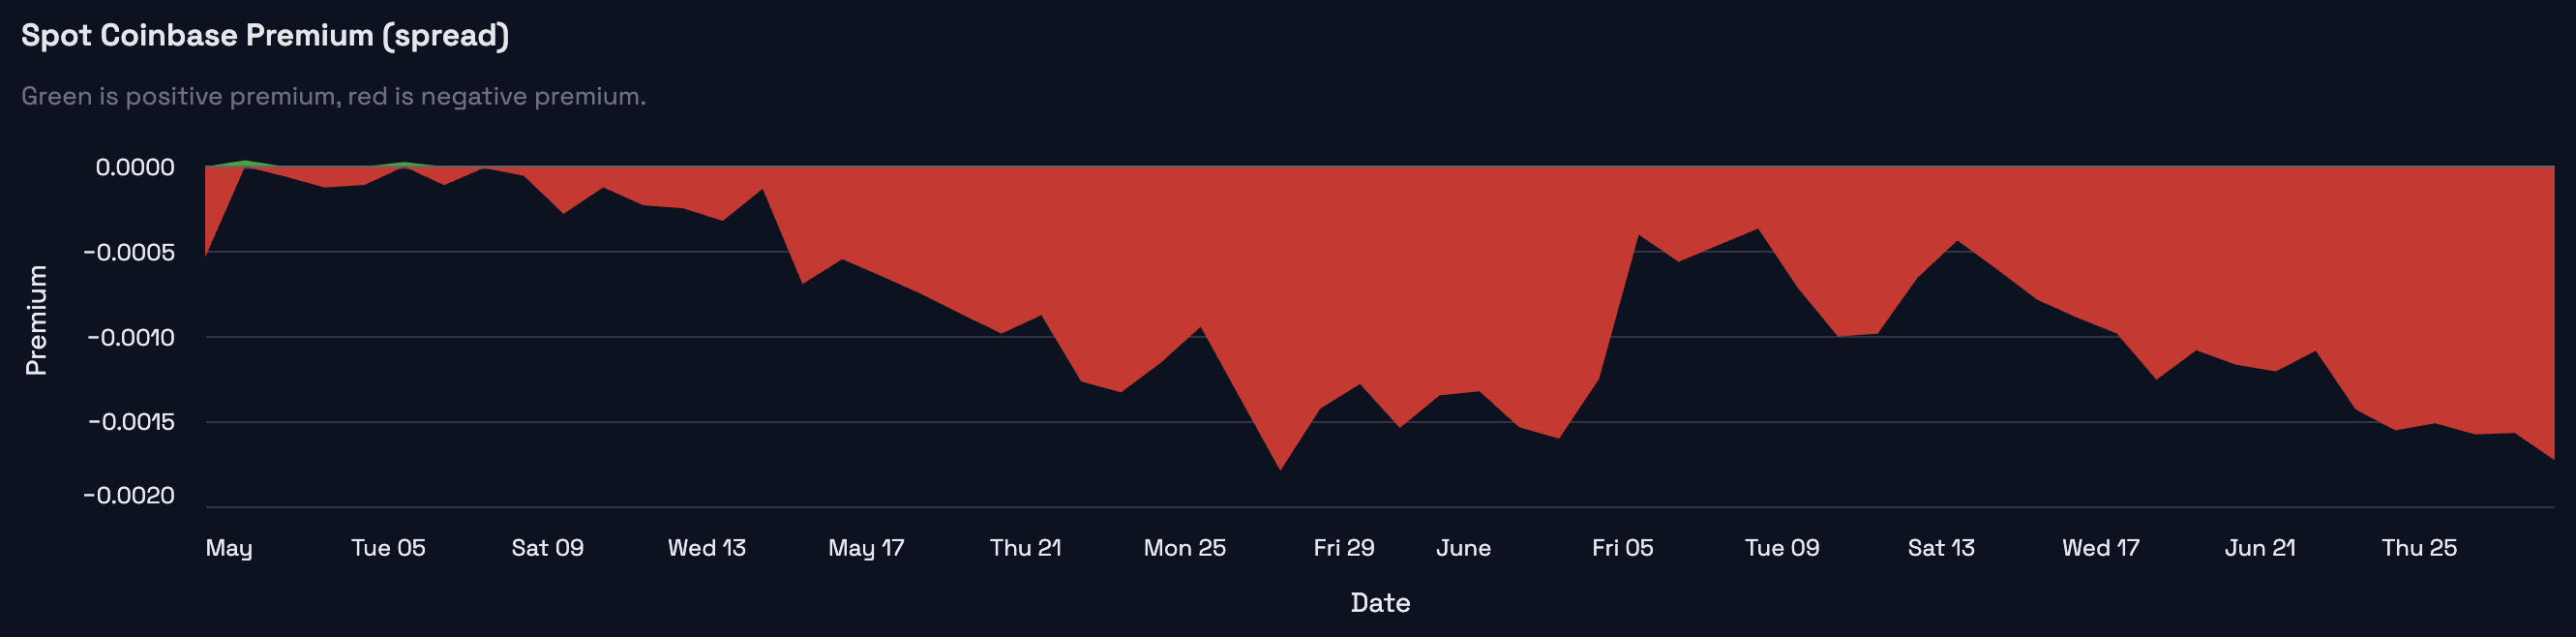
The close still did not show a clean reset. Coinbase premium weakened from roughly -0.108% to -0.173%, keeping Coinbase below Binance. Spot volume delta deteriorated by about $14.9M over the window and ended negative. Funding finished positive at 0.00443, and the long/short ratio ended above 2.0 after reaching a weekly high of 2.5651.
That mix argues for caution. BTC had some deleveraging characteristics, but long-side crowding and weak spot-flow support did not disappear. If BTC stabilizes, it still needs improving premium, less negative spot flow, and healthier breadth before it can carry the broader market out of Weak Downtrend.
News and Catalysts
- Bitcoin ETF outflows matched the internal weakness. Cointelegraph reported that US spot Bitcoin ETFs saw $696.3M in daily net outflows on June 26 as BTC fell below $60K, with June outflows reaching $3.61B and year-to-date net outflows reaching $4.6B. That external flow backdrop fits the Moondrops read: BTC weakness was not isolated from broader institutional-flow pressure.
- EU regulatory pressure stayed in focus. Cointelegraph reported that the European Parliament’s ECON committee urged review of whether DeFi, staking, NFTs, and crypto lending/borrowing should fall under expanded regulatory assessment, while MiCA’s transition period approached its July 1 deadline. Treat this as policy overhang, not the direct cause of the weekly selloff.
- Security risk remained part of the caution tape. The Defiant reported that AMLBot confirmed roughly $3.1M in PUSD was drained from Polymarket users through a supply-chain/front-end compromise, with Polymarket saying contracts were not compromised and promising refunds. This is not a market-wide driver, but it supports a cautious risk environment for DeFi and application-layer exposure.
External context broadly confirmed the internal Moondrops evidence. Risk appetite stayed weak, BTC flow pressure mattered, and isolated alt rallies looked more like dispersion than a durable broad-market turn.
Trade Setups 1: Oversold Mean Reversion
These are countertrend setups. They require patience because the broader market is still in Weak Downtrend, and last week’s comparable long-biased setup group had a 0/5 hit rate.
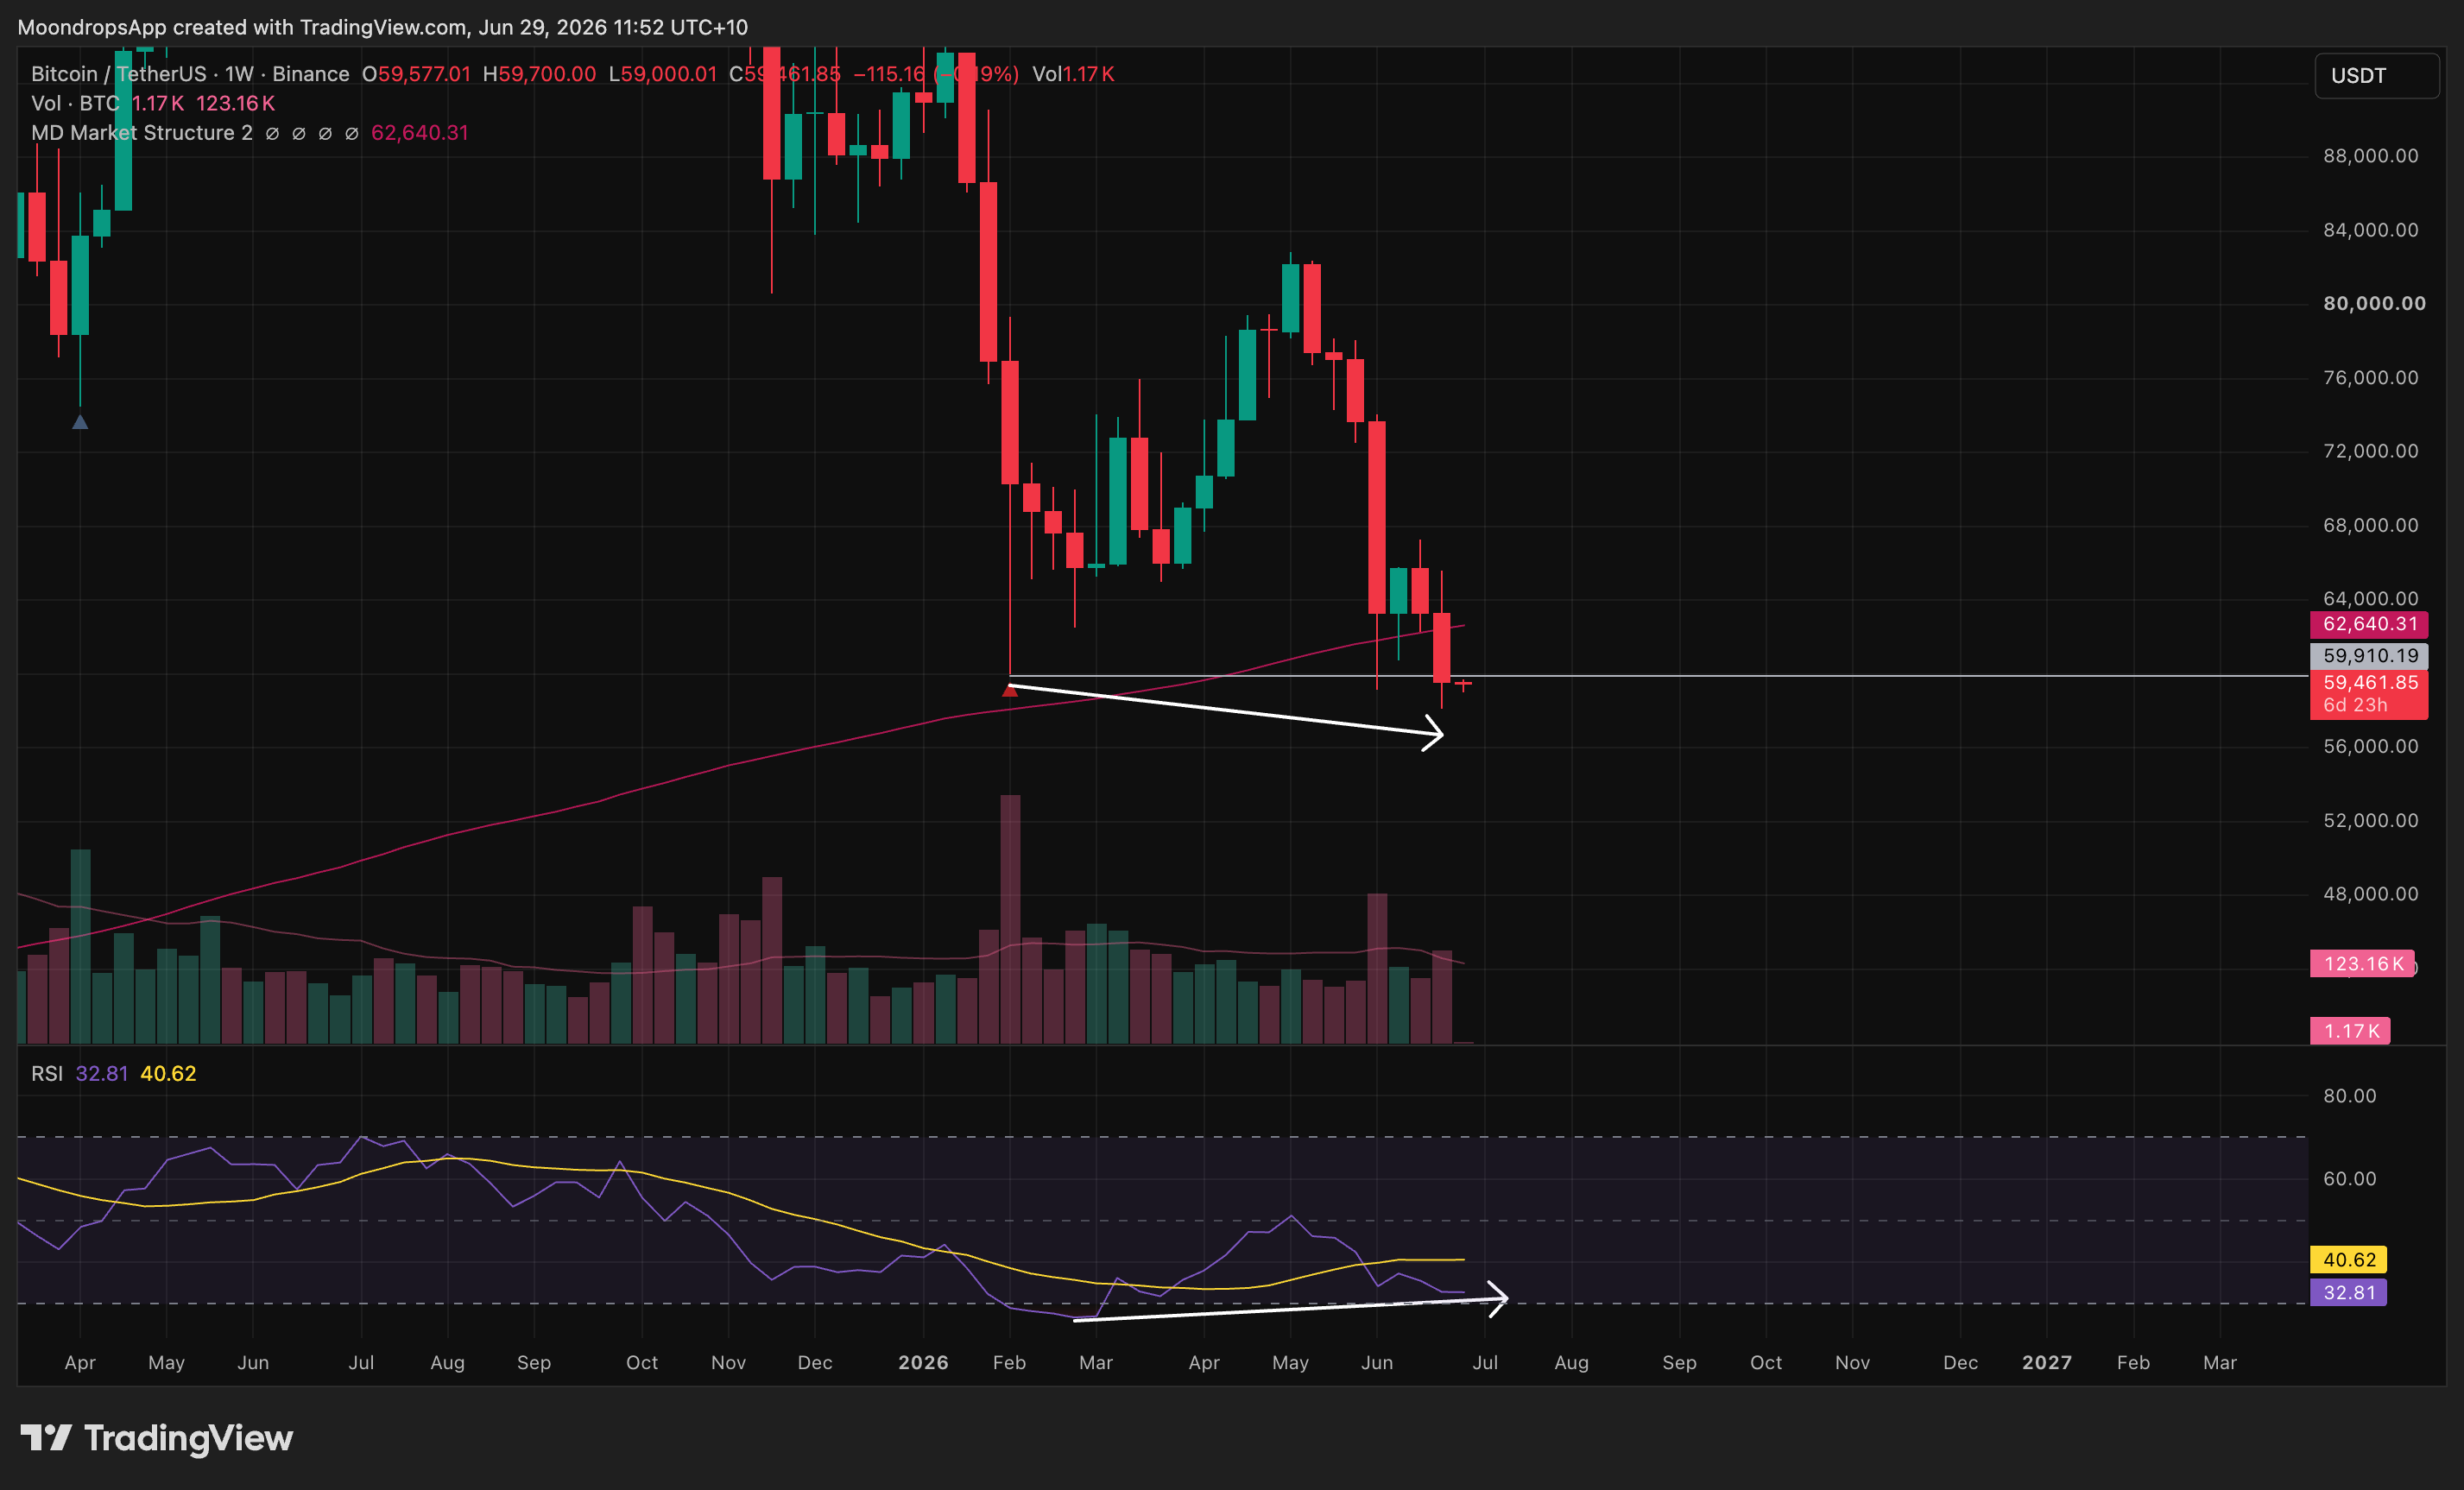
Asset: BTCUSDT
Close price: 59,577.01
Bias: Long
Thesis: BTC is the market anchor and sits in an oversold mean-reversion family while BTC sentiment shows deleveraging rather than fresh bearish open-interest expansion.
Trigger condition: A reclaim of short-term momentum with improving spot flow and a weekly move back above the prior breakdown area.
Invalidation condition: Continued closes below the weekly low area with Coinbase premium staying negative and breadth failing to improve.
Target logic: First target is a relief move back toward the prior weekly breakdown zone; extension requires breadth and BTC spot-flow confirmation.
Risk factors: ETF outflows, elevated long/short ratio, weak Coinbase premium, and broad negative market breadth.
Confidence: Medium-low until spot-flow and breadth improve.
Asset: LTCUSDT
Close price: 42.53
Bias: Long
Thesis: LTC appears in the deterministic Oversold Mean Reversion setup family and offers a cleaner liquid large-cap expression than thinner oversold names.
Trigger condition: A close back above immediate weekly resistance with RSI moving out of oversold pressure and volume delta improving.
Invalidation condition: A fresh lower low with negative volume delta expanding.
Target logic: Mean reversion toward the prior weekly range midpoint before any trend-extension target.
Risk factors: Broad weak-downtrend tape, low market participation, and failed support retests.
Confidence: Medium-low.
Asset: APTUSDT
Close price: 0.574
Bias: Long
Thesis: APT is an approved drilldown and a deterministic oversold setup candidate, with weekly close ROC near -11.42%, RSI near 28.97, and matched Support Levels plus Bullish RSI Divergences.
Trigger condition: A reclaim of support with RSI divergence confirmation and positive daily follow-through.
Invalidation condition: Loss of the weekly support area with RSI failing to stabilize.
Target logic: First target is mean reversion toward the breakdown range; continuation requires a broader alt breadth rebound.
Risk factors: Oversold can stay oversold in a Weak Downtrend, and prior long setup outcomes were poor.
Confidence: Medium-low.
Asset: LDOUSDT
Close price: 0.2448
Bias: Long
Thesis: LDO rounds out the Oversold Mean Reversion family and gives exposure to a DeFi/liquid-staking-linked name while regulatory overhang remains visible.
Trigger condition: A reclaim of the nearest weekly support zone with positive volume delta and broader DeFi stabilization.
Invalidation condition: A close below support with negative category or DeFi news flow continuing to pressure risk appetite.
Target logic: Relief target is the prior weekly balance area, not a trend-reversal target.
Risk factors: EU staking/DeFi regulatory uncertainty, weak alt breadth, and countertrend setup risk.
Confidence: Low to medium-low.
Trade Setups 2: Bearish Trend Continuation
These setups are aligned with the current market regime. Last week’s comparable bearish setup group had a 5/5 hit rate, but the group still needs careful management because oversold conditions can produce sharp relief rallies.
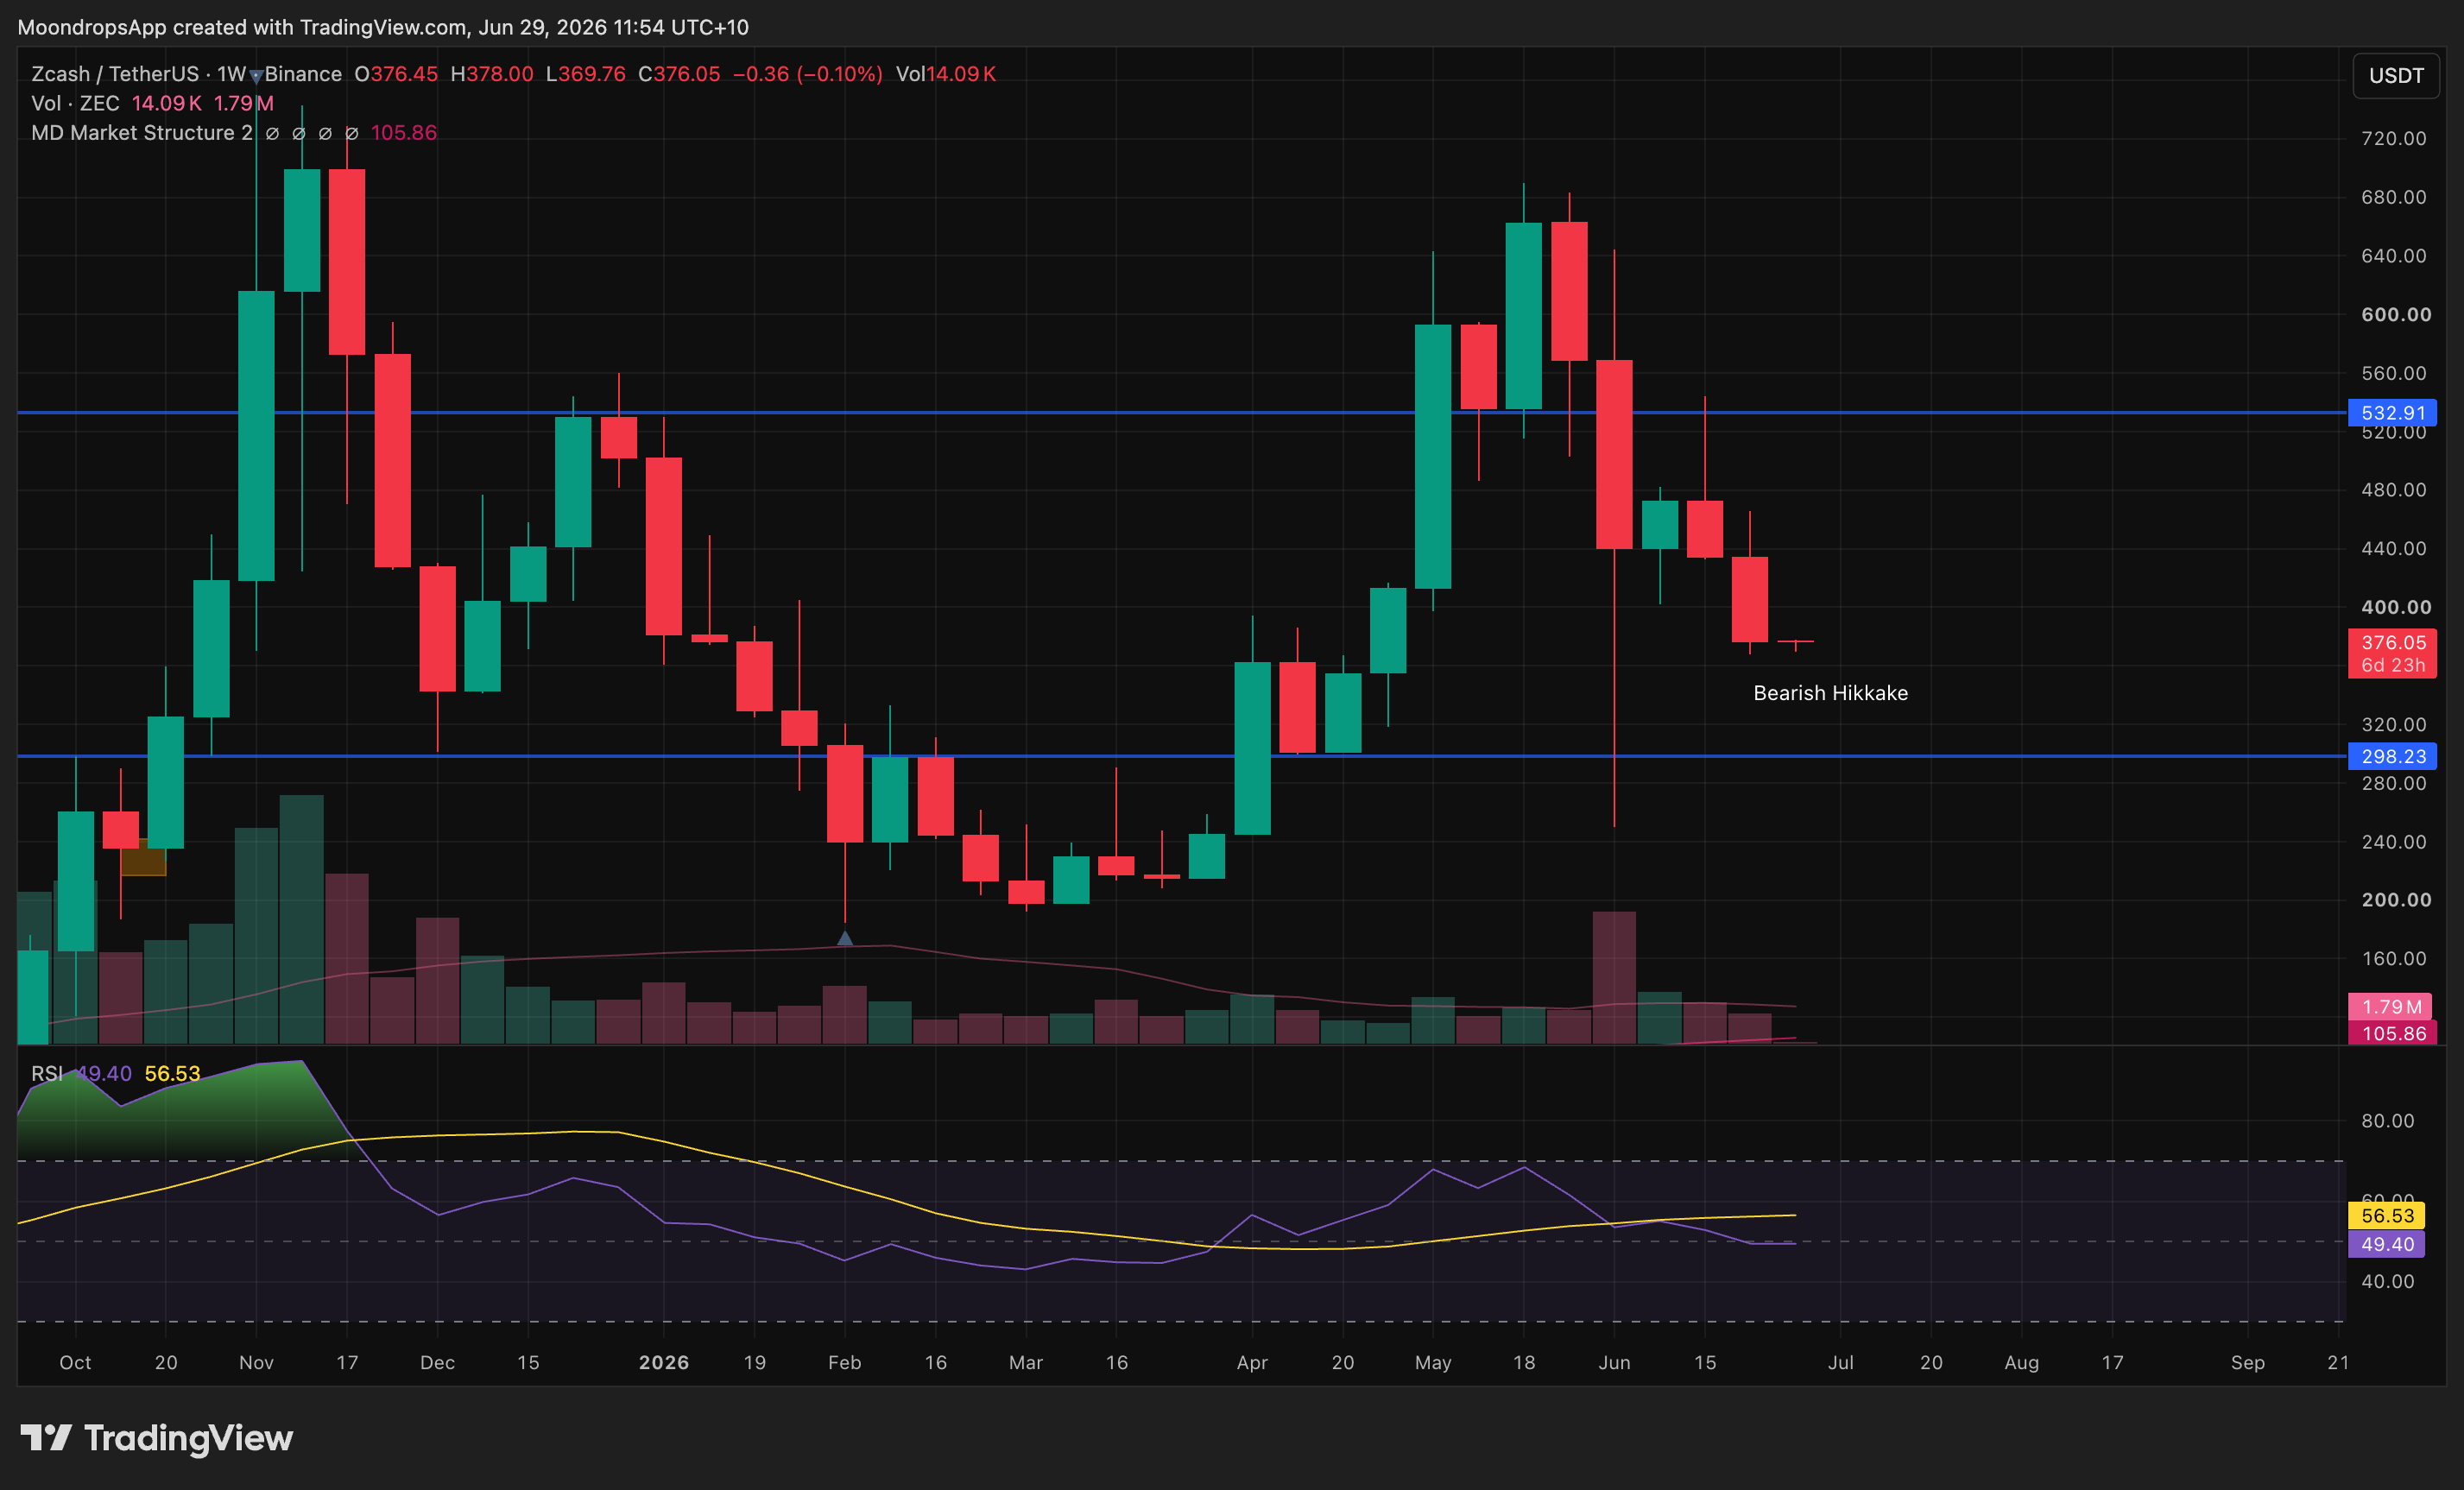
Asset: ZECUSDT
Close price: 376.41
Bias: Short
Thesis: ZEC appears in the Bearish Trend Continuation family and offers a downside-continuation setup in a market where weak trend structure remains dominant.
Trigger condition: Failed reclaim of the nearest breakdown level followed by renewed negative volume delta.
Invalidation condition: A clean reclaim of weekly resistance with expanding positive breadth.
Target logic: First target is a retest of the weekly low zone; extension depends on broader market weakness persisting.
Risk factors: Oversold relief rallies, short squeeze risk, and sudden rotation into isolated high-beta assets.
Confidence: Medium.
Asset: STGUSDT
Close price: 0.1634
Bias: Short
Thesis: STG is in the Bearish Trend Continuation family and had a deeply negative weekly close ROC near -18.75%, making it a continuation candidate if weakness persists.
Trigger condition: A weak retest that fails below resistance with bearish momentum returning.
Invalidation condition: Reclaim of the breakdown level with sustained positive volume delta.
Target logic: Retest of the weekly low first, then continuation only if the broader alt market remains in Weak Downtrend.
Risk factors: High downside already realized, relief-rally risk, and DeFi/security headline sensitivity.
Confidence: Medium.
Asset: QKCUSDT
Close price: 0.002075
Bias: Short
Thesis: QKC screens in the Bearish Trend Continuation family with bearish candlestick, bearish MACD, and Weak Downtrend evidence, while RSI remains low.
Trigger condition: A failed bounce that leaves price below resistance and momentum pointed lower.
Invalidation condition: A reclaim of the weekly range with RSI and volume improving together.
Target logic: First target is the prior weekly low; extension requires the broad market to stay weak.
Risk factors: Oversold snapback risk and lower-liquidity volatility.
Confidence: Medium-low.
Asset: ONTUSDT
Close price: 0.04236
Bias: Short
Thesis: ONT is one of the cleaner bearish continuation candidates, with weekly close ROC near -7.67% and matched Bearish Candlestick Patterns, Bearish MACD Cross, Support Levels, and Weak Downtrend.
Trigger condition: Rejection at resistance after a retest, with negative volume delta returning.
Invalidation condition: Reclaim of the failed support zone with broad alt breadth improving.
Target logic: Retest the weekly low first; continuation target depends on whether Weak Downtrend remains the dominant regime.
Risk factors: Relief rally after oversold pressure and sudden category rotation into laggards.
Confidence: Medium.
Asset Drilldowns
BTCUSDT
BTC closed at 59,577.01, down 5.90% on the week. The internal market read and BTC sentiment agree that BTC remains fragile: price weakened while open interest contracted, Coinbase premium stayed negative, and spot-flow proxies remained pressured. That supports a cautious deleveraging read rather than a clean bullish reset.
BTC is the validation asset. If it cannot stabilize and improve spot-flow conditions, oversold alt setups should be treated as tactical only. A better BTC read would require price stabilization, improving Coinbase premium, and breadth expanding beyond isolated relief names.
ETHUSDT
ETH closed at 1,571.96, down 7.91%, underperforming BTC. RSI was near oversold at 30.24, but the underperformance shows that major-asset pressure was not limited to Bitcoin. ETH’s role this week is less about leadership and more about confirming that the market’s weakness extended into core smart-contract exposure.
For next week, ETH needs to reclaim relative strength before it can validate a broader alt recovery. Without that, ETH weakness keeps pressure on DeFi, L2, and higher-beta ecosystem trades.
SOLUSDT
SOL closed at 71.38, down 1.49%, making it more resilient than BTC and ETH. That relative strength is useful, but it does not override the broad-market weak-downtrend read. SOL’s better hold suggests some ecosystem-specific support or lower forced selling, yet the overall market still lacked breadth.
SOL is the major read-through to watch if risk appetite improves. If SOL can hold relative strength while BTC stabilizes, it may become an early sign of selective risk returning. If SOL loses that relative advantage, it would confirm that late-week weakness is spreading back into the stronger large-cap pockets.
SYNUSDT
SYN was the standout category-rotation name, rising 118.27% while Layer 2 screened as the top category by mean return. The important caveat is that Layer 2 leadership was outlier-driven: the category median was still -7.62%, and only 2 of 12 Layer 2 names were positive.
That makes SYN a dispersion story, not proof of broad Layer 2 strength. It belongs in the read because it explains why category averages can look better than actual participation beneath them. For next week, the key test is whether SYN’s move broadens into more Layer 2 participation or fades as a one-off outlier.
APTUSDT
APT closed at 0.574, down 11.42%, with RSI near 28.97 and a deterministic match for Support Levels plus Bullish RSI Divergences. That makes it a clean example of the Oversold Mean Reversion family, but not a high-conviction reversal by itself.
APT’s setup depends on stabilization first. The asset needs to hold support and show follow-through before the divergence matters. If it loses the weekly support zone, the oversold signal becomes a warning that sellers remain in control rather than a reason to anticipate a bounce.
What Invalidates the Outlook
The defensive outlook weakens if breadth expands materially beyond isolated relief names. The first sign would be positive weekly rate-of-change counts improving from 53 toward a more balanced market, with bearish RSI and bearish candle counts falling at the same time.
The second invalidation would be BTC-specific. If BTC reclaims the breakdown area while Coinbase premium improves, spot flow stops deteriorating, and open interest rebuilds alongside price rather than against it, the current deleveraging/fragility read would need to soften.
The third invalidation would come from category participation. If Layer 2, Oracle/Data, or another leading category starts showing multiple positive members rather than one or two outliers, the category-rotation read would shift from dispersion to genuine participation.
What to Watch This Week
Watch BTC around the $60K area first. The market does not need BTC to become strongly bullish immediately, but it does need BTC to stop dragging breadth lower. ETF-flow headlines should also be monitored because this week’s external flow data matched the internal weakness.
Watch whether oversold conditions resolve through repair or continuation. With 189 assets in Oversold Regime and 115 oversold RSI readings, relief rallies are possible, but they need follow-through. If bounces fail quickly, bearish continuation setups remain favored.
Watch category breadth rather than category headlines. Layer 2 screened best, but the signal was outlier-heavy. A healthier market would show more positive members inside the leading categories, not just one large winner masking a negative median.
Disclaimer
This newsletter is for informational and educational purposes only and is not financial advice, investment advice, or a recommendation to buy, sell, or hold any asset. Crypto markets are volatile, and every setup can fail. Always use independent judgment, risk controls, and position sizing appropriate to your own situation.