AI Market Insights Explained

A smarter way to understand the crypto market at a glance.
What Are AI Market Insights?
The crypto market is a fast-moving web of signals, timeframes, and emotions. Most traders—especially beginners—get lost in individual charts without ever seeing the bigger picture.
AI Market Insights in Moondrops was built to fix that.
It gives you a complete view of the overall crypto market, summarizing data from hundreds of assets into one clear snapshot — showing where momentum, trends, and sentiment are shifting.
Instead of diving into dozens of charts, you can open one page and instantly see how the entire market is behaving.
AI Market Insights turns raw data into an overview of the crypto landscape—simple, smart, and intuitive.
Why We Built It
Crypto moves 24/7, across hundreds of coins and multiple timeframes.
For most traders, staying on top of everything is impossible — trends conflict, volume shifts, and momentum changes before you can react.
We wanted to create a way to summarize the market itself — not just individual assets.
AI Market Insights analyzes technical data across the market and presents it as a structured, human-readable overview.
You don’t have to interpret hundreds of indicators — the AI does that for you, then explains what it found.
How It Works (Without the Hype)
Our approach is straightforward:
- Aggregate: The AI scans technical data from hundreds of crypto assets.
- Analyze: It evaluates indicators across 1H, 4H, 1D, and 1W timeframes.
- Categorize: Data is grouped into key indicator categories — Price Action, Trend, Momentum, and Volume & Volatility.
- Summarize: It identifies broad patterns (bullish, bearish, or mixed) and highlights where signals conflict or align.
- Explain: The results are presented in plain English summaries, giving traders instant clarity about the overall market landscape.
No predictions. No jargon. Just a clear, AI-driven summary of what’s really happening.
Sample AI Market Insights
Here’s a sample of a real Moondrops AI Market Insights report:
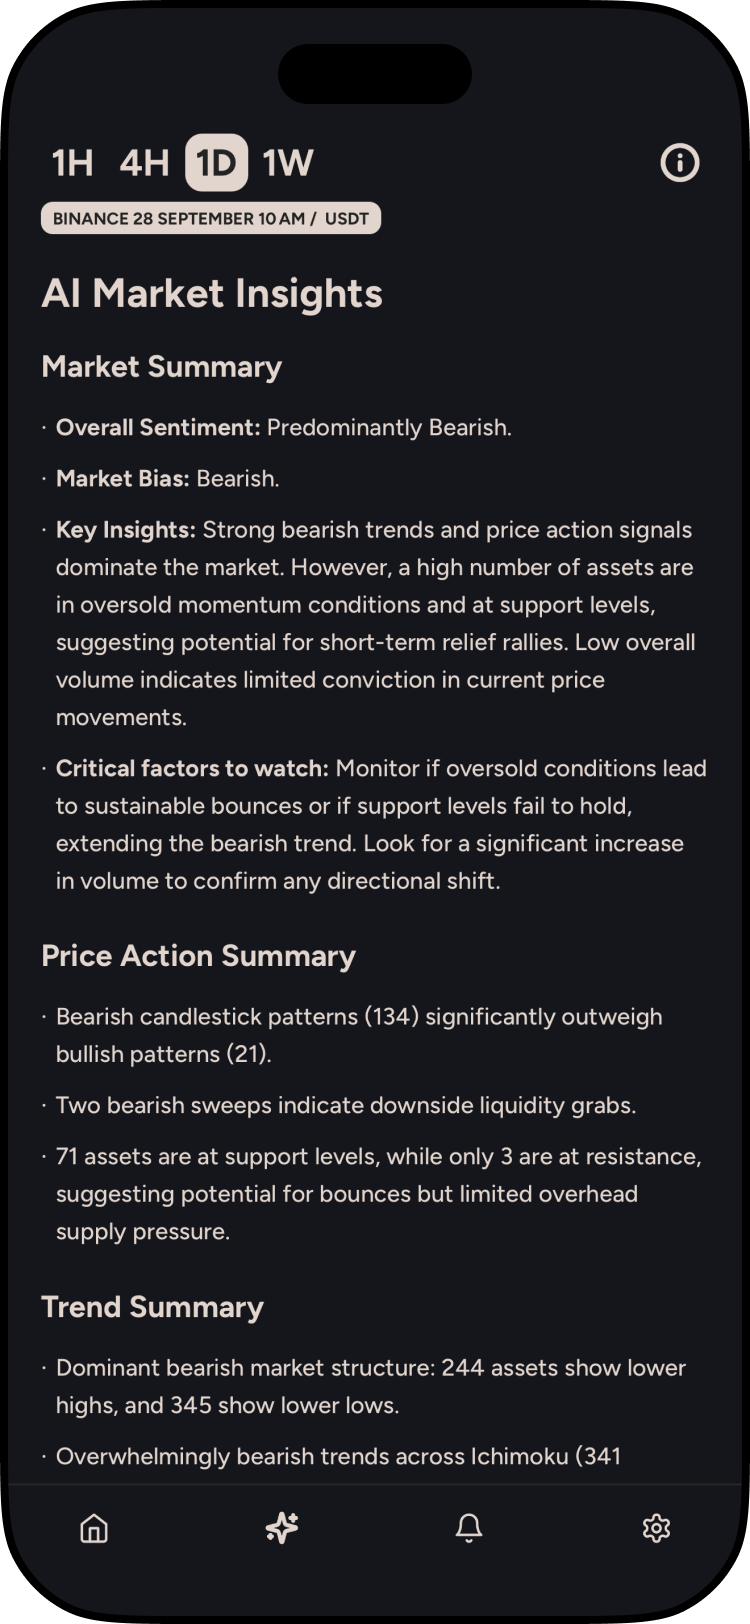
Price Action Summary
- Bearish sweeps are noted (7), suggesting downside pressure.
- Significant bullish Fibonacci 61.8% retests (74) indicate potential support holds or retracement finishes.
- Bullish candlestick patterns (80) outnumber bearish patterns (44), signaling short-term buying interest.
- Limited bullish (3) and bearish (0) breakouts suggest consolidation rather than strong directional moves.
Trend Summary
- Market structure shows a dominant bearish bias with more assets exhibiting Lower Highs (239) and Lower Lows (213).
- Long-term trends (EMA 200, Ichimoku Kumo) are predominantly bearish (280 and 263 assets, respectively).
- VWAP/Price trend is strongly bullish (298 assets), indicating short-term strength.
- Short-to-mid-term momentum indicators (MACD, EMA 12/26, Ichimoku crosses) show a bullish shift.
- Overall trend strength is weak for most assets (317 weak ADX trends).
Momentum Summary
- Momentum is largely positive, with most assets having Bullish RSI (266) and Positive Rate of Change (332).
- A high number of assets (238) are Stochastic RSI Overbought, suggesting potential short-term pullbacks.
- Limited extreme RSI conditions (4 overbought, 2 oversold) and minimal divergences.
Volume & Volatility Summary
- The majority of assets (245) are experiencing low relative volume, indicating reduced trading conviction.
- Negative Volume Delta (235) outweighs positive (164), signaling net selling pressure.
- More assets exhibit extreme positive Z-scores (17) than negative (1), pointing to isolated high upward volatility.
Market Summary
- Overall Sentiment: Mixed. Underlying bearish structure meets short-term bullish momentum.
- Market Bias: Mixed — signals are conflicting.
- Key Insights: Long-term trend indicators remain bearish, but short-term momentum is building strength.
- Critical Factors to Watch: Traders should watch for sustained volume confirmation on directional moves.
How to Use AI Market Insights
Use AI Market Insights as your macro-level guide:
- Before trading, check the market’s overall tone (bullish, bearish, or mixed).
- Compare timeframes — if short-term momentum clashes with long-term trends, volatility may increase.
- Pair with Strategy Alerts to stay notified when the market’s overall bias changes.
- Use a mobile crypto screener when you want to move from broad context into filtered assets, watchlists, and alerts on your phone.
- Save time — let AI summarize the data, then decide where to focus your attention.
It’s your high-level market radar — keeping you oriented before diving into specific assets.
Why It Matters
Understanding the market’s overall state is just as important as tracking any single coin.
AI Market Insights helps traders of all levels see the big picture — faster, clearer, and without noise.
We built it to make crypto analysis more accessible, more transparent, and ultimately more actionable.
Because real insight isn’t about more data — it’s about the right data, simply explained.
Try It Yourself
Open Moondrops and explore your AI Market Insights today.
See how quickly clarity replaces confusion — and how simple crypto analysis can really be.