How Moondrops Turns Complex Crypto Analysis Into Something You'll Actually Use
Crypto market analysis, made simple - here's what that looks like in practice.
You've downloaded a crypto app before. Maybe a few. You opened it, saw a wall of candlestick charts and acronyms you didn't recognize, and quietly closed it. You're not alone - most trading tools are built for people who already know what they're doing.
Moondrops was built for the moment right before that. The moment where you're curious about crypto markets, want to make informed decisions, but don't have ten years of chart-reading experience. It's an app that brings institutional-grade analysis to your phone and actually explains what it all means.
Here's a look at how each piece of the platform works - and why it matters, even if you're just getting started.
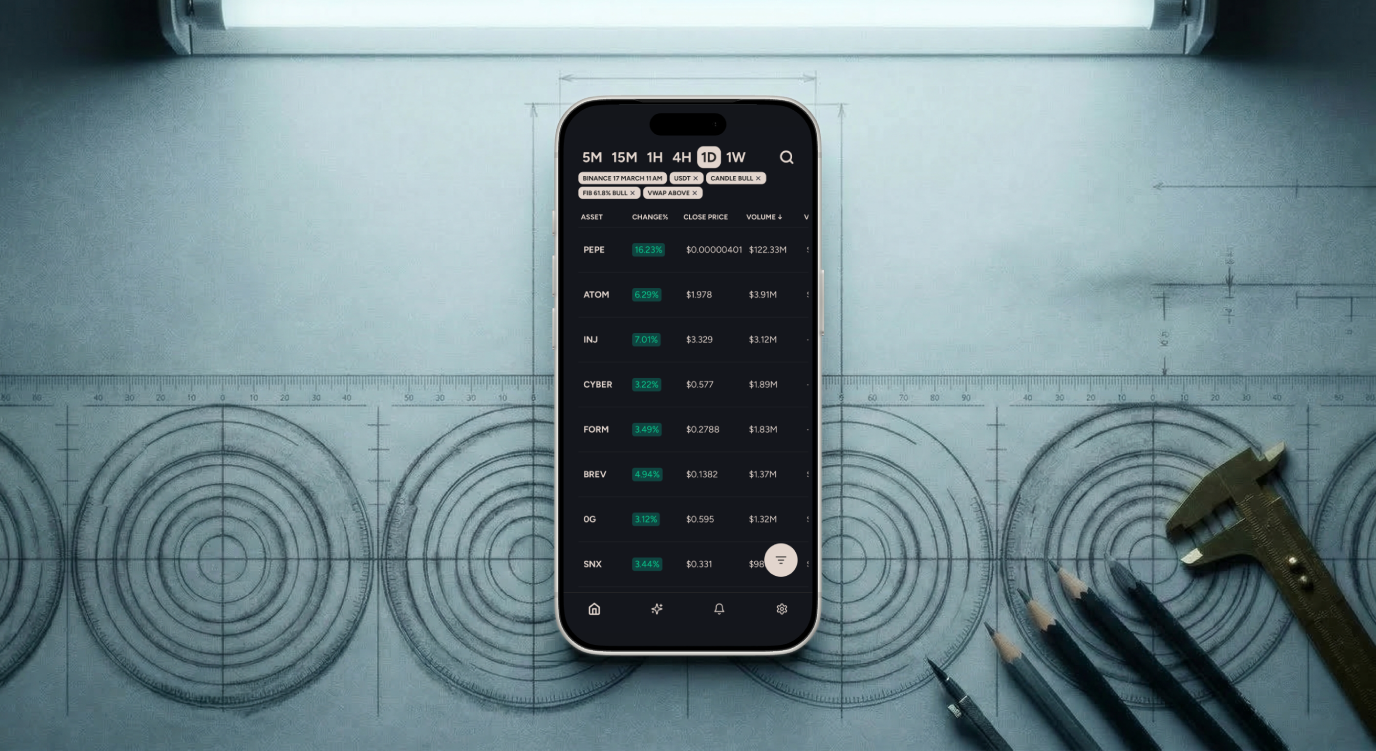
Your Dashboard: Everything in One Place
The first thing you see when you open Moondrops is the Dashboard - a single screen that tracks price, volume, and indicator data across 400+ crypto assets. Instead of jumping between tabs or apps, you get a consolidated view of what's moving and why.
What makes this different from a basic price tracker? Filtering. You can sort assets by indicator behavior across six timeframes - from weekly all the way down to five-minute - so you're not just seeing what moved, but how the underlying data is shifting. For a beginner, this means you can start spotting patterns without building your own spreadsheets or staring at raw charts for hours.
Think of it as a market scanner that does the heavy lifting for you, surfacing the assets worth paying attention to based on real technical data rather than social media hype.
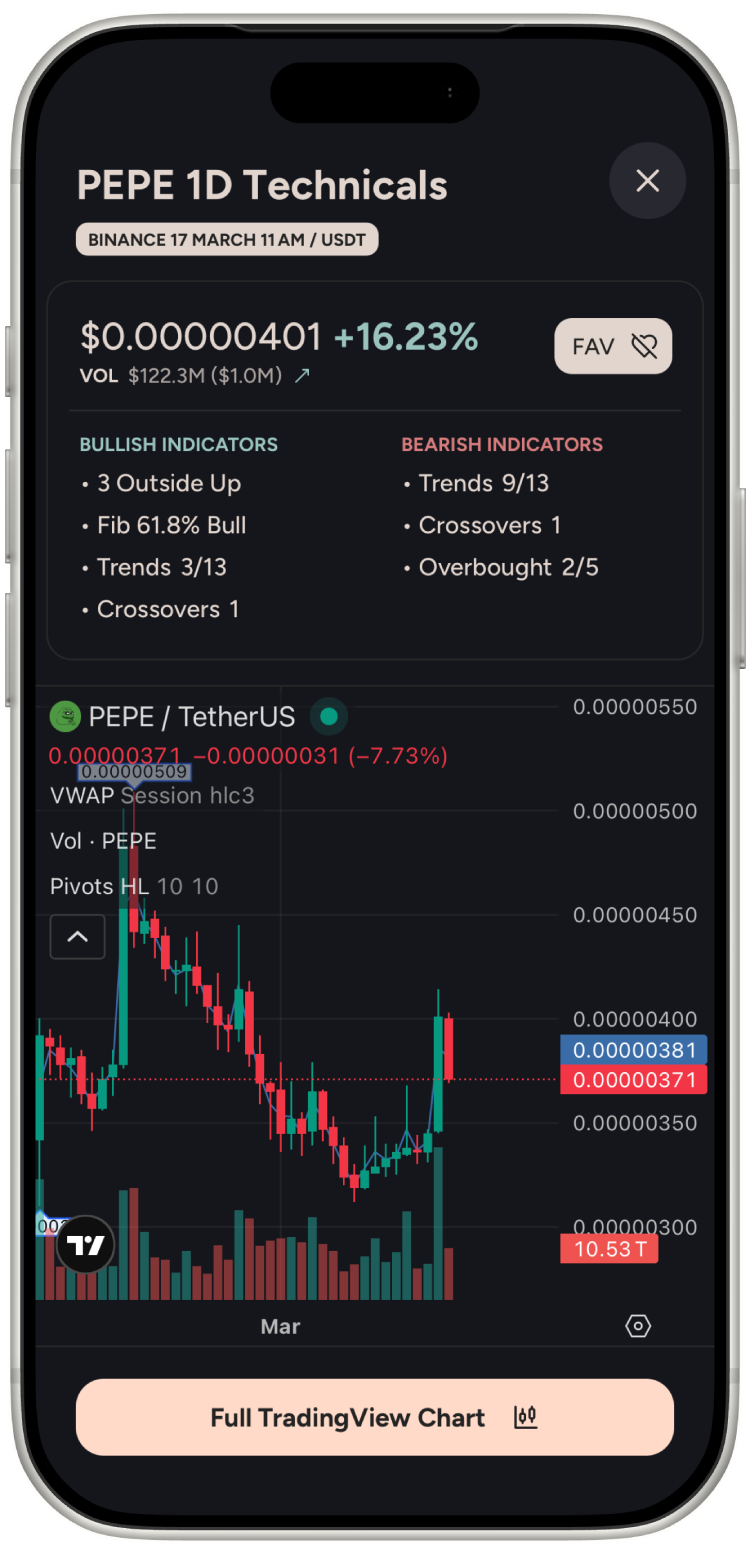
Technicals: Understanding Any Asset at a Glance
Tap on any asset from the Dashboard and you'll land on its Technicals view. This is where Moondrops goes deeper - showing you 40+ professional indicators organized across six timeframes (1W, 1D, 4H, 1H, 15M, 5M).
If terms like MACD, RSI, or Bollinger Bands sound unfamiliar, that's okay. The Technicals view doesn't just display raw numbers - it presents a structured bullish or bearish breakdown so you can understand the overall direction an asset is leaning, even if you're still learning what each indicator measures.
Over time, this is where the educational side of Moondrops kicks in. Each time you check Technicals for an asset, you start to recognize which indicators tend to align before a move happens. You're not just using a tool - you're building pattern recognition skills that make you a more informed trader.
The key here is multi-timeframe analysis. A single timeframe can be misleading. An asset might look bullish on the hourly chart but bearish on the weekly. Moondrops lets you toggle between all six with a tap, so you can quickly build the full picture before making a decision. That's the kind of cross-timeframe intelligence that professional trading desks rely on - now available on your phone.
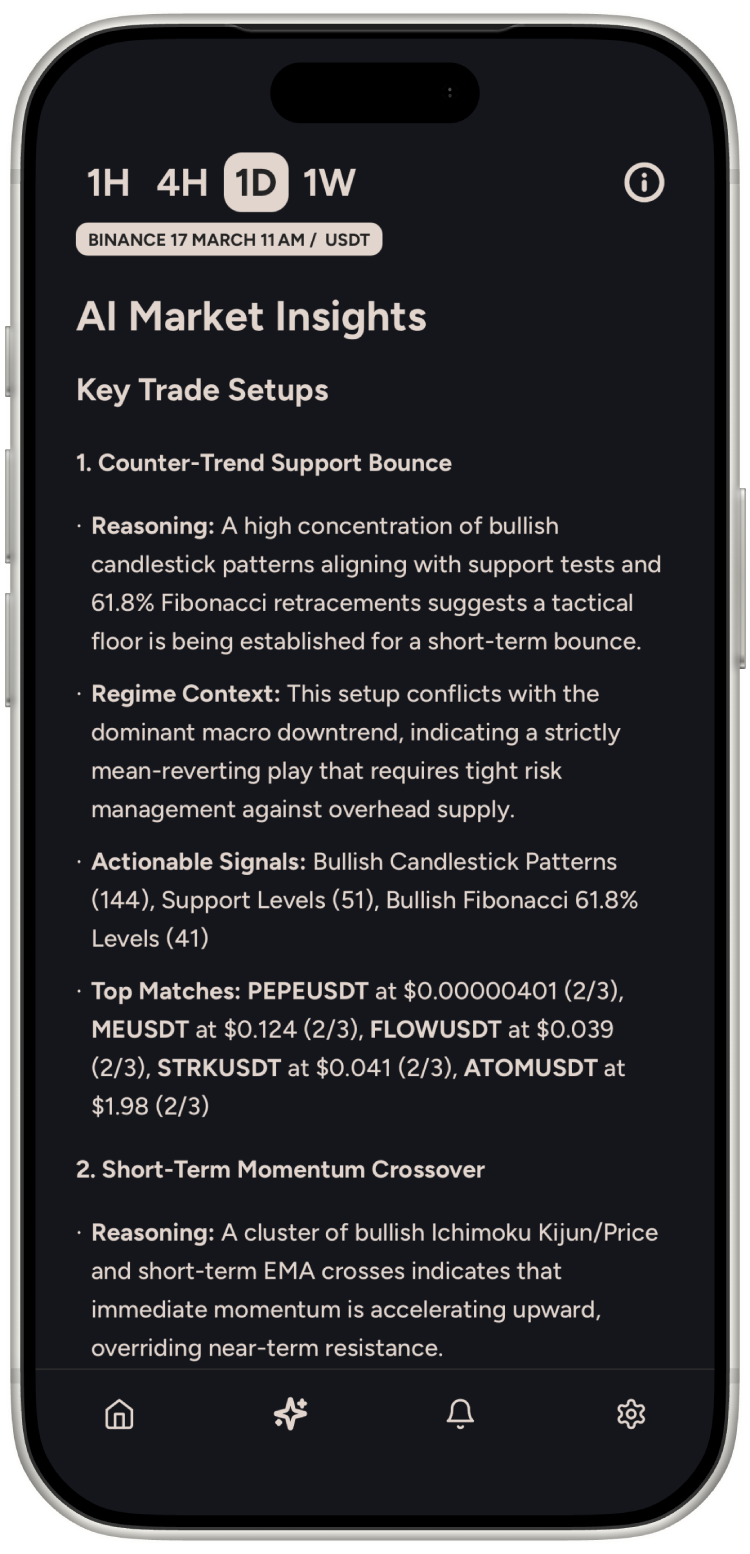
AI Market Insights: Your Analysis Shortcut
Here's where things get interesting for beginners especially. AI Market Insights is Moondrops' AI-powered analysis engine that reads the same indicator data you see in Technicals and generates a structured, plain-language summary.
Instead of interpreting 40+ indicators yourself, the AI does it for you - surfacing a real-time bias (bullish, bearish, or neutral), identifying the key factors driving that assessment, and highlighting what to watch next. It condenses what could take hours of manual analysis into something you can read in seconds.
This isn't a crystal ball or a trading signal telling you what to buy. It's a structured analytical summary - the same kind of analysis a professional trader would do manually, delivered automatically. Moondrops is built to make you smarter about markets, not to replace your judgment.
For beginners, AI Market Insights acts like having a knowledgeable friend walk you through the data. Instead of guessing what a chart means, you get a clear explanation grounded in the actual numbers. And as your understanding grows, you can cross-reference the AI's summary with the raw Technicals view to develop your own analytical instincts.
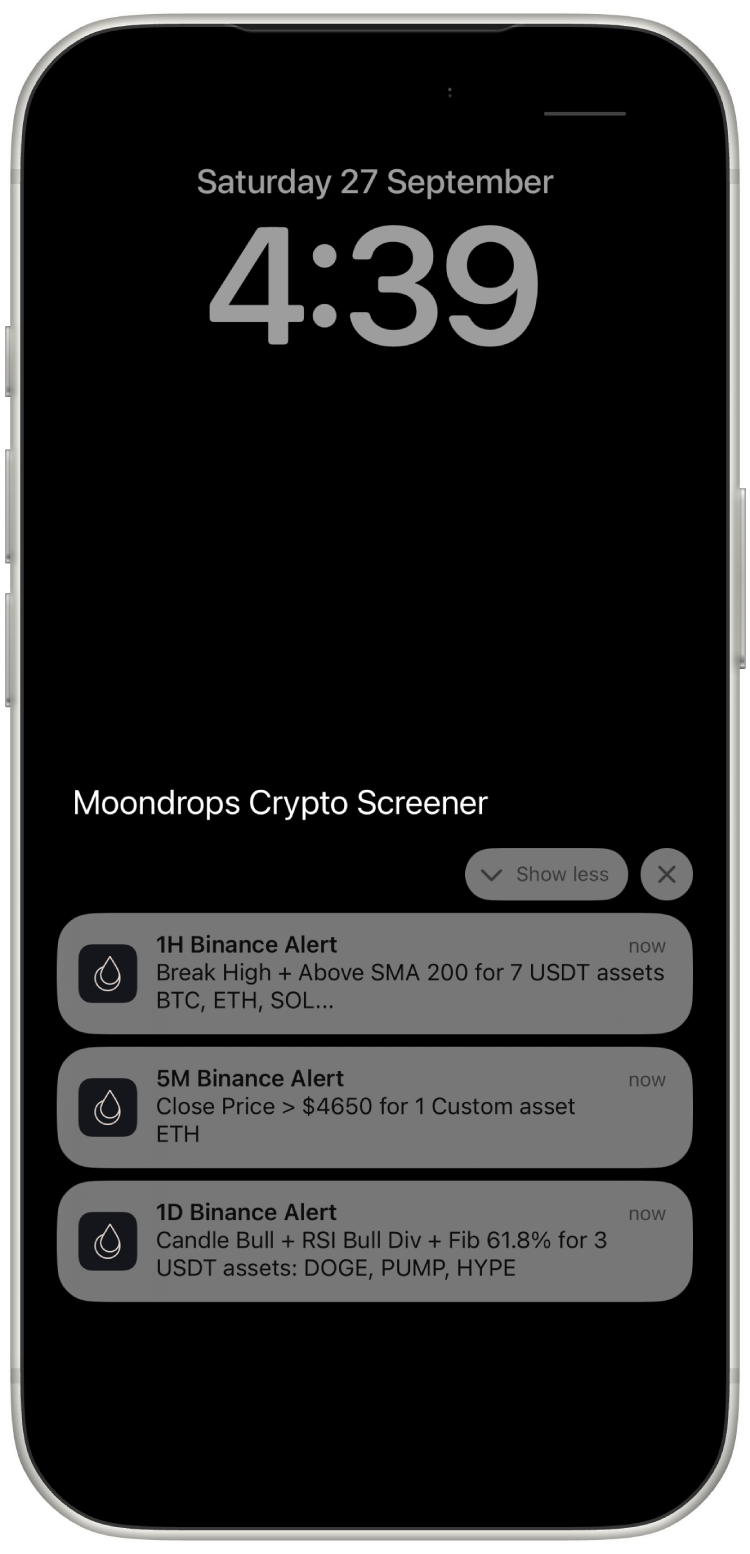
Strategy Alerts: Opportunities That Come to You
Markets don't wait for you to open an app. That's why Moondrops includes Strategy Alerts - automated notifications triggered by the indicator conditions you care about, running across all supported assets.
You set the filters. Maybe you want to know when any asset meets a specific combination of indicator conditions on a given timeframe. Strategy Alerts scan continuously, so you can step away from your screen and still catch setups that match your criteria.
For beginners, this solves a practical problem: you don't have to spend all day watching charts. You define what "interesting" looks like based on technical conditions, and Moondrops tells you when it happens. It's a way to stay engaged with the market without it becoming a full-time job.
Strategy Alerts are available with Premium Plus and represent one of the most valuable features for traders at any experience level - the ability to automate your watchlist and let data do the monitoring.
Why This Matters for Beginners
Most crypto education tells you what indicators are. Moondrops shows you how they behave in real time, across real assets, with real data. That's a fundamentally different learning experience.
Every time you check the Dashboard, explore Technicals, read an AI Market Insight, or set up a Strategy Alert, you're building practical knowledge. You start to understand why multi-timeframe analysis matters, what indicator confluence looks like, and how to filter noise from opportunity.
The platform is designed so that the more you use it, the more you understand - not because it lectures you, but because it puts professional-grade data in front of you in a way that's clear enough to learn from.
Get Started
Moondrops is available on iOS and Android. The free tier gives you access to the Dashboard, Technicals, and a taste of AI Market Insights. Premium Plus unlocks the full AI engine and Strategy Alerts.
No hype. No promises. Just data-driven tools that help you understand the market better, one insight at a time.
Open Moondrops and see what crypto analysis looks like when it's made simple.
Moondrops does not provide financial advice. All analysis and insights are for informational and educational purposes only.